At the European University Institute, the Centre for Media Pluralism and Media Freedom is organizing a Summer School for Journalist and Media Practitioners.
The very rich program will allow for some sharing of experiences also about “New trends in data journalism” and “Paying for news (new ways of getting revenues for media outlets and journalists)”.
1. “New trends in data journalism”
FUN – The hero of the genre is Hans Rosling. He is a master in explaining the civic, scientific, cultural and social value of statistics and stresses out the importance of being able to communicate them in plain language. He has been followed by statisticians, graphic specialists, and journalists. He has made good statistics fun. And this had opened some minds.
This video is a good way to spend an hour.
DIGITAL – Data journalism has always been there since there have been data. But digital technologies have made it easier and cheaper. With all new sorts of designing solutions. And a lot of different ways to interact with the results
Information is beautiful is just one of a lot of sites that could be interersting to visit to find out inspiration and examples. Here are, for example, some of the most famous “mountains of fear”
E se interessa il debito seguito alla crisi, visto dall’America, ecco un video molto suggestivo.
INFORMATION OVERLOAD – If there is such a thing as an information overload, there must be some research about new filters. But there also must be some research about new synthetic ways to understand so many data. This is a job for news outlets that are based on teams composed by journalists, designers and programmers. If La Vita Nòva has been awarded quite a few prices it must be because it has always been made that way.
OPEN DATA – Public money is spent in acquiring data. So that data must be public. That’s the way the European Commission looks at the matter. And we can trust public opinions to enforce that view.
But public administrations don’t have a standard way to keep their data. To put them together in an useful way will be a very big job for lot’s of people. See OpenPolis.
WORKFLOW – A quite good Wikipedia entry shows how can be described the process of creating a story by data crunching.
The process is about:
1. Find: Searching for data on the web
2. Clean: Process to filter and transform data, preparation for visualization
3. Visualize: Displaying the pattern, either as a static or animated visual
4. Publish: Integrating the visuals, attaching data to stories
5. Distribute: Enabling access on a variety of devices, such as the web, tablets and mobile
6. Measure: Tracking usage of data stories over time and across the spectrum of uses.
EXAMPLES – To take a look at the best recent data driven journalism stories, one can take a look at the very recent Data Journalism Awards.
BENCHMARK – The Guardian DataBlog. Ahref DataBlog.
2. “Paying for news (new ways of getting revenues for media outlets and journalists)”
Where is the new scarcity? (More time and less pages)
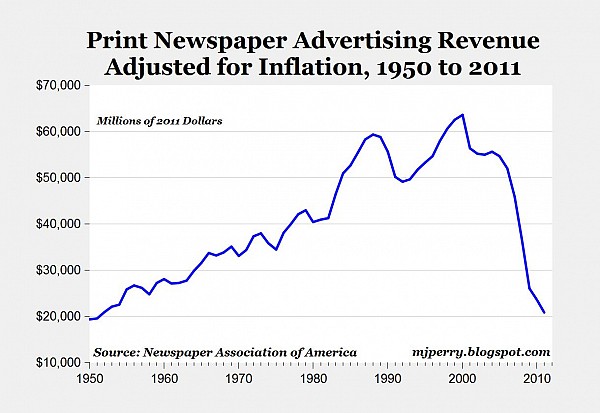
How advertising is paying what? (Paper ads fall, digital grow but not enough; and that growth is declining, Reuters)
What is it that people are willing to pay? (Profit, non profit)
Requiem for the media, Jean Baudrillard, 1972
The dead media manifesto, Bruce Sterling, 1998
Who killed the newspaper, the Economist. And: Not dead yet
New sources of revenue for the industry of information
Advertising: 100 on paper, 10 on the web, 1 on mobile
Apps: at the Guardian, an app has made more revenue than cost
A data rich blog, il Giornalaio
Vedi anche:
Giornali equilibrati
Background, giornalismo
L’alba di un nuovo giornalismo


Commenta